
Bury's average house price reached a record £245,206 in September, up 3.3% in a year. Semis rose fastest; flats barely moved. Every type, ranked.
The average home in Bury sold for £245,206 in September 2026. That is another record for the borough, and the second in a row.
HM Land Registry published the figures in its UK House Price Index for September on Wednesday 18 November. Bury’s average was 0.3% higher than in August. It was 3.3% higher than a year earlier, when it stood at £237,356. That is a rise of £7,850 in twelve months.
Bury rose slightly faster than the North West, where prices went up 3.2%. England as a whole rose just 0.8%.
How Bury compares
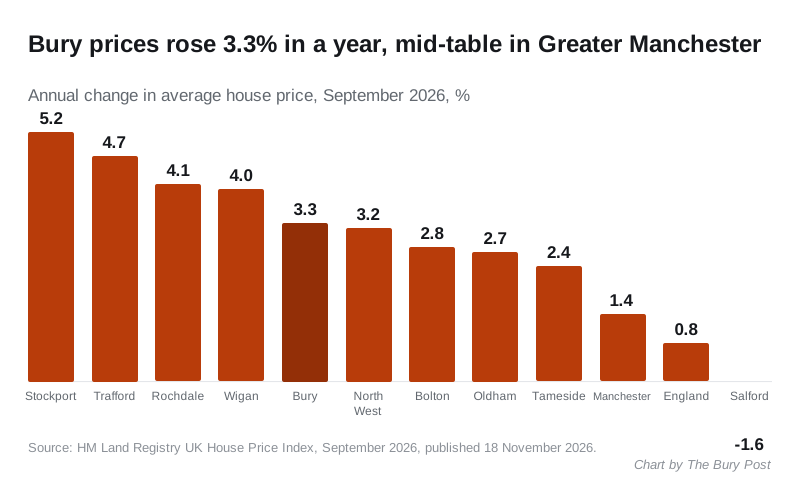
Bury sits fifth of the ten Greater Manchester boroughs for growth. It is fourth for price, behind Trafford, Stockport and Manchester.
| Area | Average price, September 2026 | Change in a year |
|---|---|---|
| Trafford | £394,017 | +4.7% |
| Stockport | £321,895 | +5.2% |
| Manchester | £254,604 | +1.4% |
| Bury | £245,206 | +3.3% |
| Salford | £226,019 | -1.6% |
| Oldham | £216,189 | +2.7% |
| Tameside | £215,409 | +2.4% |
| Rochdale | £212,685 | +4.1% |
| Bolton | £202,170 | +2.8% |
| Wigan | £198,228 | +4.0% |
| North West | £220,477 | +3.2% |
| England | £292,998 | +0.8% |
Rochdale, Bury’s neighbour to the east, rose faster over the year. Bolton, to the west, rose a little more slowly. Salford is still the only borough in the county where the average fell. Oldham’s average dropped 2.0% in a single month, the biggest monthly fall in the county.
What is rising and what is not
Every type of home in Bury rose in value over the year, but flats only just.
| Property type | September 2025 | September 2026 | Change |
|---|---|---|---|
| Semi-detached | £263,299 | £273,575 | +£10,276 (+3.9%) |
| Terraced | £197,440 | £204,291 | +£6,851 (+3.5%) |
| Detached | £405,561 | £418,740 | +£13,179 (+3.2%) |
| Flat or maisonette | £135,329 | £135,599 | +£270 (+0.2%) |
The index also splits buyers:
- First-time buyers paid an average of £216,331, up 3.5% on a year.
- Homeowners moving on paid £287,651, up 3.2%.
- Buyers with a mortgage paid £249,028. Cash buyers paid £234,278.
The longer view
Four years ago, in September 2022, the Bury average was £223,693. It has risen by £21,513 since then, or 9.6%.
Read the figures with care
- It is a mean average, not a median. A few expensive sales can pull it up. The typical home in Bury may well sell for less than £245,206.
- The latest month is provisional. Land Registry revises it as late sales are registered. This release raised Bury’s August average from £243,107, the figure we reported in October, to £244,362.
- The index is adjusted for the mix of homes sold, so a month with lots of detached sales does not skew it.
What it means for you
- If you are selling, the Bury market is still rising steadily: about £654 a month on the average home over the past year.
- If you are buying a first home, the average terraced house now costs £204,291. Flats are cheaper at £135,599 and have hardly moved in a year.
- If you want to know what your street sells for, recent individual sales are on our Bury house prices page, drawn from Land Registry’s price paid data.
Source: HM Land Registry UK House Price Index, September 2026, published 18 November 2026.
Have your say