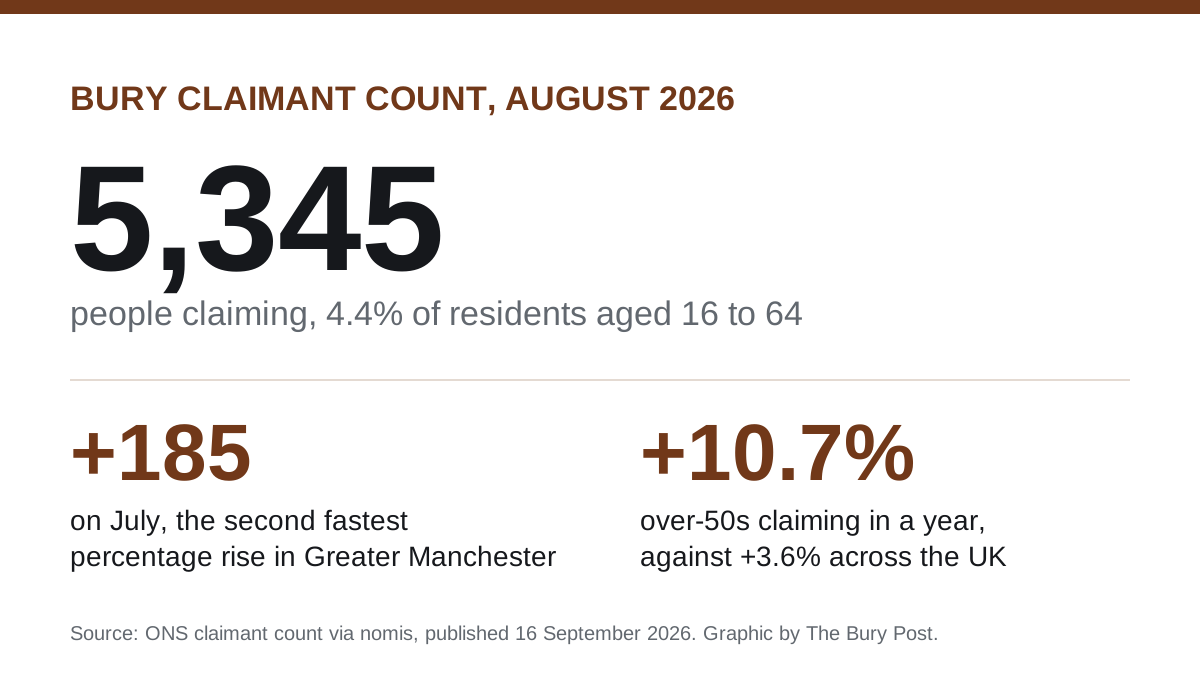

5,345 people in Bury claimed jobless benefits in August, up 185 in a month. Claims by over-50s are up 10.7% in a year, nearly three times the UK rate.
5,345 people in Bury were claiming unemployment-related benefits in August. That is 4.4 per cent of residents aged 16 to 64.
The figures come from the ONS claimant count, published through nomis on Wednesday. They show 185 more claimants than in July, a rise of 3.6 per cent in one month.
Only Wigan, at 3.7 per cent, rose faster in percentage terms across Greater Manchester. The UK figure rose 2.3 per cent and the North West’s 2.5 per cent.
August does not usually go up
Claims in Bury fell between July and August in each of the last two years:
- 2024: down 20, from 5,935 to 5,915
- 2025: down 65, from 5,200 to 5,135
- 2026: up 185, from 5,160 to 5,345
This year’s is the largest monthly rise since February, when the count went up by 300.
Over twelve months, Bury has 210 more claimants than in August 2025, a rise of 4.1 per cent. The UK rose 2.1 per cent over the same year and the North West 2.9 per cent. Salford, Trafford and Tameside rose faster than Bury in Greater Manchester.
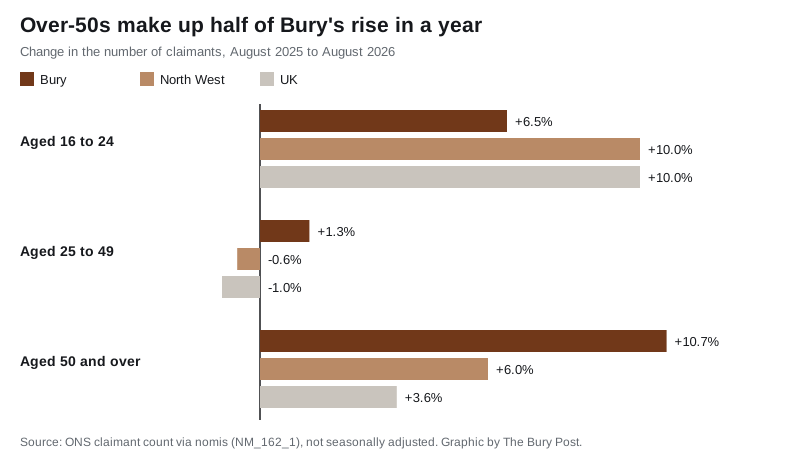
Half the rise is people over 50
Split by age, the biggest change in Bury is not among young people.
| Age group | August 2025 | August 2026 | Change |
|---|---|---|---|
| 16 to 24 | 1,080 | 1,150 | +70, +6.5% |
| 25 to 49 | 3,070 | 3,110 | +40, +1.3% |
| 50 and over | 985 | 1,090 | +105, +10.7% |
Claimants aged 50 and over rose by 105, half of the borough’s increase. Across the UK that age group rose 3.6 per cent, and across the North West 6.0 per cent. In Greater Manchester only Salford, at 12.9 per cent, had a sharper rise among over-50s.
Young claimants rose more slowly than elsewhere. Bury’s 16 to 24 count rose 6.5 per cent, against 10.0 per cent both nationally and in the North West.
Where in the borough
Fifteen of Bury’s 17 wards had more claimants in August than in July. Radcliffe West and Unsworth were unchanged. The largest monthly rises were:
- Sedgley, up 30 to 315, now 3.9 per cent
- Radcliffe East, up 25 to 450, now 5.9 per cent
- Radcliffe North and Ainsworth and Bury West, both up 20
The gap between wards has not closed. Bury East, which contains the town centre, is highest at 7.7 per cent, followed by Moorside at 7.6 and Redvales at 7.1. North Manor is lowest at 1.9 per cent.
| Ward | Claimants, August | Rate |
|---|---|---|
| Bury East | 715 | 7.7% |
| Moorside | 590 | 7.6% |
| Redvales | 555 | 7.1% |
| Radcliffe East | 450 | 5.9% |
| Radcliffe West | 385 | 5.1% |
| Besses | 325 | 4.5% |
| Elton | 280 | 3.9% |
| Sedgley | 315 | 3.9% |
| Radcliffe North and Ainsworth | 270 | 3.7% |
| Holyrood | 255 | 3.5% |
| St Mary’s | 255 | 3.4% |
| Bury West | 210 | 3.3% |
| Unsworth | 200 | 2.9% |
| Pilkington Park | 140 | 2.4% |
| Ramsbottom | 165 | 2.2% |
| Tottington | 135 | 2.2% |
| North Manor | 100 | 1.9% |
July’s figure has been revised down
When we reported July’s figures, the ONS count was 5,270. The same month now reads 5,160, 110 lower. Every ward’s July figure has moved with it.
That changes July’s comparison with a year earlier. On the revised figure, July 2026 was 40 below July 2025, not 70 above it. Claimant counts for the latest month are routinely revised when the next month is published, so August’s 5,345 may move too.
What the claimant count is, and is not
This is not the unemployment rate. The count records people on Jobseeker’s Allowance, or on Universal Credit while required to look for work. So it:
- includes some people in work, whose earnings are low enough to keep them under work search rules
- excludes people out of work who are not claiming
- is not seasonally adjusted, which is why the fairest comparison is with the same month a year earlier
- is rounded to the nearest five
What it means for you
If you are over 50 and looking for work in Bury, you are in the group whose numbers grew fastest this year. The council’s NeighbourHub at 18 Union Arcade in the Mill Gate brings employment and skills support, adult learning and digital help into one town centre unit.
If you live in Radcliffe, Radcliffe East had the second biggest ward rise this month, and Radcliffe North and Ainsworth was joint third.
If you want to check the figures yourself, the ward and age data are in nomis dataset NM_162_1, which updates monthly.
For more on the borough, see our reports on record house prices in July and the Bury Interchange consultation.
Have your say